Diamondback Energy stock: more barrels, less debt, same capital budget
FANG stock analysis and fair value · bull and bear case
The call: SageNoodle rates Diamondback Energy Fairly Valued: base-case fair value USD 180 against a price of USD 192, 6% below the quote on a 3-5 years horizon. The second-quarter update improved the near-term operating picture: production exceeded 1 million barrels of oil equivalent per day and management raised full-year production guidance without increasing its capital budget.
Diamondback Energy stock has a stronger operating update to weigh than a quiet trading day suggests. Higher production guidance and lower net debt help the case, while oil-price exposure and the unchanged capital bill keep the valuation sensitive.
Valuation as of 4 Oct 2026 · Quote currency: USD. Latest quote: Fri, 09 Oct 2026 19:14:22 GMT.
Written with AI from the linked sources and reviewed by a SageNoodle editor. How we work.
Latest quote
USD 192.46
At publication
USD 184.71
Fair value
USD 180.00
Upside
-6.5%
P/E at publication
35.1x
EV/EBITDA
Not available
FCF yield
Not available
ROIC 2.0% · Horizon 3-5 years
Why Diamondback Energy (FANG) stock is mispriced
- 01
The second-quarter update improved the near-term operating picture: production exceeded 1 million barrels of oil equivalent per day and management raised full-year production guidance without increasing its capital budget.
- 02
Debt reduction and strong reported free cash flow support the equity case, but quarterly cash generation benefited from high realized oil prices and is not a dependable annual run rate.
- 03
At $184.71, the shares sit close to a preliminary $180 per-share base value; commodity prices and the durability of earnings matter more than a marginal daily move.
What Diamondback Energy does and how it makes money
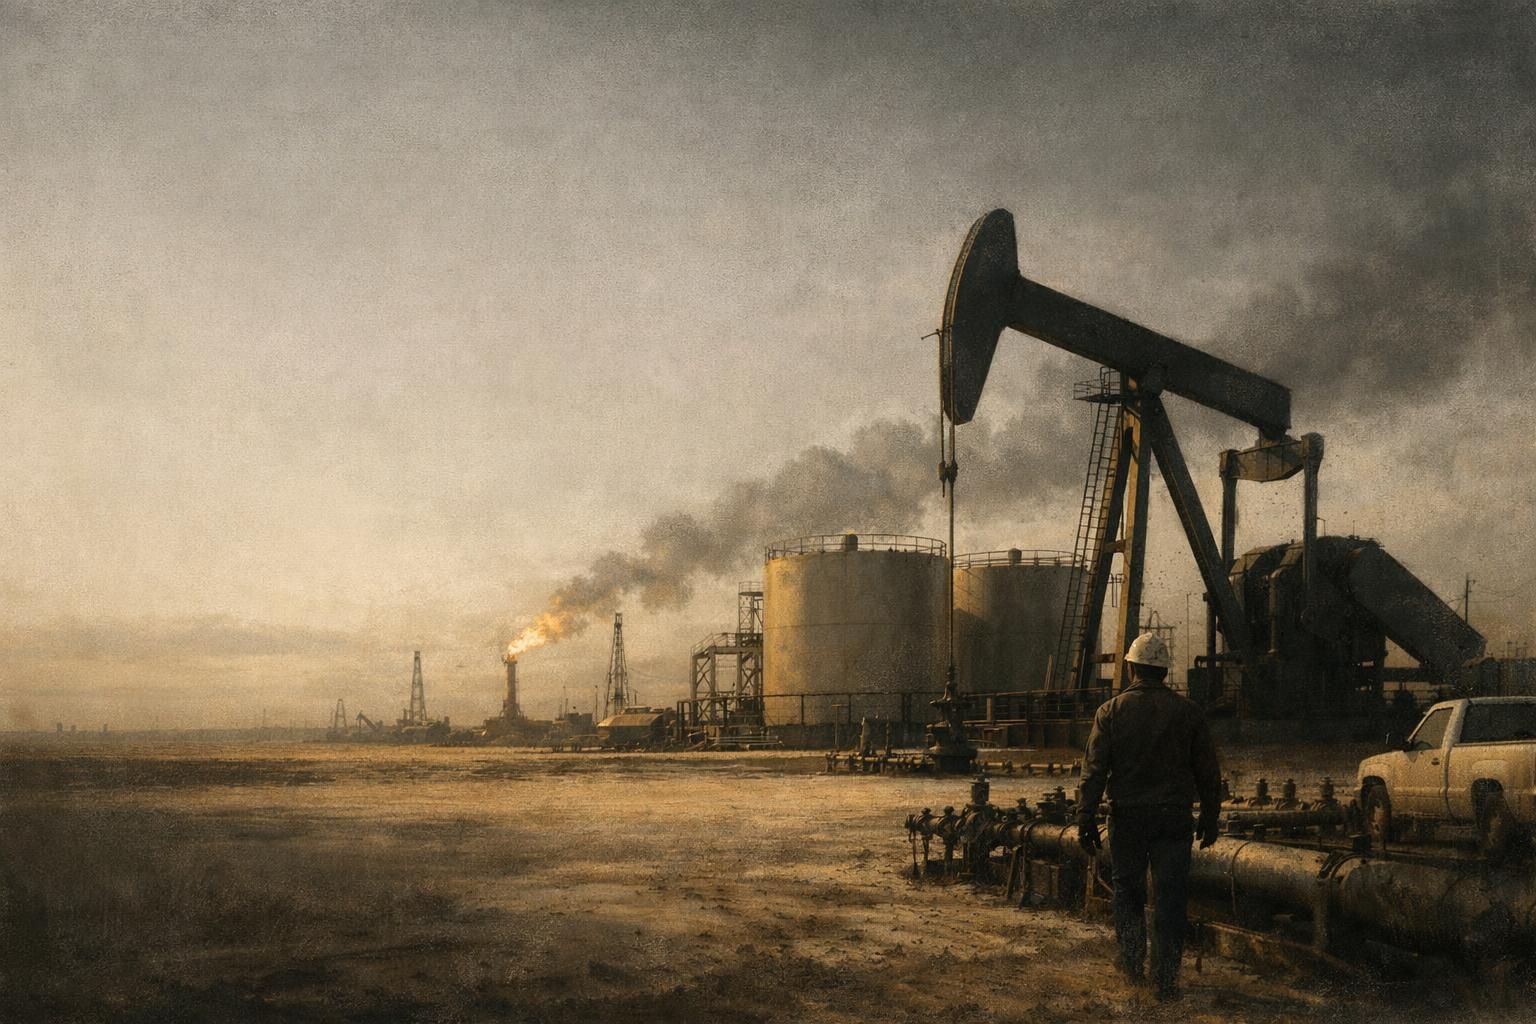
Diamondback Energy, Inc. (FANG) is a Midland, Texas-based independent oil and natural gas producer focused primarily on unconventional reserves in the Permian Basin of West Texas. It earns revenue by producing and selling crude oil, natural gas and natural gas liquids, with results shaped by realized commodity prices, production volumes, operating costs and the spending required to drill and complete wells. Its second-quarter 2026 release reports production and financial results on a consolidated basis, including Viper Energy. For the quarter ended June 30, 2026, Diamondback reported total revenue of $5.562 billion and average production of 1,017,659 barrels of oil equivalent per day. Its production is concentrated in the Permian, so basin-level operating conditions and the prices it realizes for oil and gas are central to the business. Second Quarter 2026 Financial and Operating Results
For the financial history and all coverage, see Diamondback Energy, Inc. (FANG) company research.
What actually changed in Diamondback’s operating outlook?
There is no verified company disclosure here explaining a 0.4% move on October 4, 2026, and no basis to attribute that small daily decline to a particular event. It reported production above 1 million barrels of oil equivalent per day and raised its 2026 production guidance. Second Quarter 2026 Financial and Operating Results
The company raised its annual oil-production guidance to 522+ thousand barrels per day from 520+, and total production guidance to 1,000+ thousand barrels of oil equivalent per day from 972+. It left full-year cash capital spending at approximately $3.9 billion. That combination is the useful development: Diamondback expects more output from the planned spending envelope, but it has not announced a lower capital requirement.
Why do production and debt matter more than the day’s noise?
Higher production guidance can support revenue and cash generation if prices and realized sales conditions hold. The second-quarter results show why the qualification matters. Average realized oil price was $96.82 per barrel, and natural gas averaged negative $2.15 per Mcf. The company’s combined realized price was $51.68 per barrel of oil equivalent. Oil was valuable; gas, in that quarter, was a costlier part of the mix. Second Quarter 2026 Financial and Operating Results
Diamondback reported $2.330 billion of free cash flow for the quarter, a non-GAAP measure it defines using operating cash flow before working-capital changes less cash capital expenditures. It also reported $12.304 billion of consolidated net debt at June 30, down from $13.894 billion at March 31. That debt reduction gives the company more room to absorb a weaker commodity quarter, but it does not remove the exposure: cash flow depends on prices, production and a continuing capital program. The quarterly free-cash-flow figure should not be treated as a forecast of four identical quarters.
What does the update imply for FANG stock’s value?
At $184.71, the stock’s trailing P/E is 35.1 times trailing EPS of $5.26. That multiple is a poor standalone anchor for a producer whose earnings can move sharply with realized oil and gas prices. FY2025 revenue growth was 35.8%, but operating margin was 8.4% and ROIC was 2.0%. Growth in sales has not translated into consistently high returns on capital.
There is no prior SageNoodle fair value to carry forward, so this is a preliminary, assumption-led estimate rather than a full reserve-based valuation. The base case uses assumed normalized annual EPS of $9.00 and a 20-times earnings multiple: $9.00 × 20 = $180 per share. The $9 EPS assumption is above the trailing $5.26, but below the second-quarter reported EPS of $6.65 annualized; neither trailing nor annualized quarterly earnings is assumed to persist. The valuation therefore gives some credit to the higher production outlook without capitalizing one strong quarter as permanent.
That puts the shares near fair value, not at a clear discount. The production raise supports the business outlook at the margin. It does not resolve the larger question of sustainable earnings across a commodity cycle.
What could prove the case wrong?
The bullish case weakens if realized oil prices retreat, gas remains difficult to market, or production fails to meet the new guidance while spending stays near plan. A high oil price helped the latest quarter; the negative realized natural-gas price is a reminder that barrel-equivalent production does not mean every barrel-equivalent earns the same amount.
Diamondback’s planned third-quarter 2026 results and conference call are scheduled for November 3, 2026. The company’s Q3 guidance is 517–527 thousand barrels of oil per day and capital expenditures of $950–$1,050 million. The reported quarter will test delivery against that plan. Second Quarter 2026 Financial and Operating Results
No verified company disclosure establishes why FANG is down 0.4% today. The latest operating update improved production guidance and showed lower quarter-end net debt, but neither fact explains the day’s trading.
Follow SageNoodle on Google
Diamondback Energy revenue, margins and cash flow
Revenue (USD, billions)
Margins (%)
Free cash flow (USD, billions)
Estimated ROIC (%)
Net debt (USD, billions)
Monetary values are in USD; revenue, FCF and net debt are in billions; EPS is per share. Missing values appear as gaps and “Not available.” Source: SEC EDGAR XBRL filings, latest restated values; quarterly cash flow derived from year-to-date figures; Q4 = fiscal year minus nine months. ROIC is NOPAT (21% tax) over debt plus equity.
| Period | Revenue | Gross % | Op % | FCF | EPS | ROIC % | Net debt |
|---|---|---|---|---|---|---|---|
| FY2017 | 1.21 | Not available | 50.2 | Not available | 4.94 | 7.10 | 1.37 |
| FY2018 | 2.18 | Not available | 46.5 | Not available | 8.06 | 4.40 | 4.25 |
| FY2019 | 3.96 | Not available | 17.5 | Not available | 1.47 | 2.95 | 5.25 |
| FY2020 | 2.81 | Not available | -194.7 | Not available | -28.6 | -30.0 | 5.52 |
| FY2021 | 6.80 | Not available | 58.9 | Not available | 12.2 | 16.9 | 5.99 |
| FY2022 | 9.64 | Not available | 67.5 | Not available | 24.6 | 24.2 | 6.08 |
| FY2023 | 8.41 | Not available | 54.3 | Not available | 17.3 | 15.5 | 6.06 |
| FY2024 | 11.1 | Not available | 39.7 | Not available | 15.5 | 6.97 | 11.9 |
| FY2025 | 15.0 | Not available | 8.43 | Not available | 5.73 | 1.97 | 13.6 |
What Diamondback Energy management has said
Guidance
Direct quote
“Increasing annual oil production guidance to 522+ (from 520+) MBO/d and total BOE production to 1,000+ (from 972+) MBOE/d with full year cash capital expenditures unchanged at ~$3.9 billion”
Capex
Direct quote
“The program has no time limit and may be suspended, modified or discontinued at the Board’s discretion.”
Diamondback Energy fair value: bear, base and bull scenarios
Dot marks the latest quote of USD 192.46.
Bear
25%USD 128
Direct equity valuation using assumed normalized EPS multiplied by an assumed earnings multiple.
Equity value USD 35.99B ÷ 0.281B diluted shares
- Normalized annual EPS
- $8.00, analyst assumption; weaker commodity economics reduce earnings from the base case
- P/E multiple
- 16x, analyst assumption
- Calculation
- $8.00 × 16 = $128, rounded to $130
- Shares
- 0.281202 billion diluted shares, supplied latest point value
Lower commodity realizations or weaker production economics reduce normalized earnings, and investors assign a lower multiple to the cyclical profit stream, implying $128 per share.
Base
50%USD 180
Direct equity valuation using assumed normalized EPS multiplied by an assumed earnings multiple.
Equity value USD 50.62B ÷ 0.281B diluted shares
- Normalized annual EPS
- $9.00, analyst assumption; above supplied trailing EPS of $5.26 but below Q2 2026 EPS annualized
- P/E multiple
- 20x, analyst assumption
- Calculation
- $9.00 × 20 = $180 per share
- Shares
- 0.281202 billion diluted shares, supplied latest point value
Production guidance improves and debt falls, while normalized earnings remain below a simple annualization of the strong second quarter to account for commodity volatility.
Bull
25%USD 230
Direct equity valuation using assumed normalized EPS multiplied by an assumed earnings multiple.
Equity value USD 64.68B ÷ 0.281B diluted shares
- Normalized annual EPS
- $10.00, analyst assumption; stronger sustained production and commodity economics
- P/E multiple
- 23x, analyst assumption
- Calculation
- $10.00 × 23 = $230 per share
- Shares
- 0.281202 billion diluted shares, supplied latest point value
Higher production is delivered with stable capital spending and cash generation, while investors accept a higher multiple for stronger normalized earnings.
Diamondback Energy (FANG) stock: bullish vs bearish case
Bull case
- The company lifted both oil and total production guidance while keeping planned 2026 cash capital spending unchanged.
- Second-quarter free cash flow and the decline in quarter-end net debt show that strong operating conditions can translate into balance-sheet repair.
- The base dividend and share repurchases return cash to shareholders when company cash generation permits.
Bear case
- Commodity prices and realized sales conditions can change faster than production volumes; the quarter included a negative realized natural-gas price.
- The FY2025 metrics show an 8.4% operating margin and 2.0% ROIC despite 35.8% revenue growth, leaving questions about returns on the enlarged capital base.
- The $3.9 billion full-year cash capital budget remains a substantial commitment, so weaker prices or execution could reduce cash available for debt repayment and shareholder returns.
Diamondback Energy stock risks
| Risk | Severity | Probability | Rationale |
|---|---|---|---|
| Oil and gas price volatility | High | High | Revenue and cash flow depend on commodity prices and realized sales terms. The Q2 2026 release reported an average oil price of $96.82 per barrel and a natural-gas price of negative $2.15 per Mcf. |
| Capital intensity and execution | High | Medium | Management kept 2026 cash capital expenditure guidance at approximately $3.9 billion. Higher output must be delivered without cost overruns or weaker well performance to support the expected cash return. |
| Debt and shareholder returns | High | Medium | Net debt was $12.304 billion at June 30, 2026. Future repurchases are discretionary and the company states its authorization may be suspended, modified or discontinued. |
| Permian concentration | High | Medium | Diamondback says its operations focus primarily on the Permian Basin, concentrating exposure to regional operating, infrastructure and regulatory conditions. |
Diamondback Energy catalysts: what could move FANG stock
- 2026-11-03Neutral
Planned third-quarter 2026 results and conference call
Diamondback’s planned results can be assessed against the Q3 production and capital guidance in its August 3 release.
Diamondback Energy fair value history
| Period | Fair value | Verdict | Note |
|---|
Diamondback Energy news
Diamondback Energy stock: common questions
- Is Diamondback Energy (FANG) stock undervalued or overvalued?
- SageNoodle rates Diamondback Energy Fairly Valued: base-case fair value USD 180 against a price of USD 192, 6% below the quote on a 3-5 years horizon. The second-quarter update improved the near-term operating picture: production exceeded 1 million barrels of oil equivalent per day and management raised full-year production guidance without increasing its capital budget.
- What is Diamondback Energy's fair value?
- Bear USD 128 (25% probability, Direct equity valuation using assumed normalized EPS multiplied by an assumed earnings multiple.); Base USD 180 (50% probability, Direct equity valuation using assumed normalized EPS multiplied by an assumed earnings multiple.); Bull USD 230 (25% probability, Direct equity valuation using assumed normalized EPS multiplied by an assumed earnings multiple.). Production guidance improves and debt falls, while normalized earnings remain below a simple annualization of the strong second quarter to account for commodity volatility.
- What is the bull case for FANG stock?
- The company lifted both oil and total production guidance while keeping planned 2026 cash capital spending unchanged. Second-quarter free cash flow and the decline in quarter-end net debt show that strong operating conditions can translate into balance-sheet repair. The base dividend and share repurchases return cash to shareholders when company cash generation permits.
- What is the bear case for FANG stock?
- Commodity prices and realized sales conditions can change faster than production volumes; the quarter included a negative realized natural-gas price. The FY2025 metrics show an 8.4% operating margin and 2.0% ROIC despite 35.8% revenue growth, leaving questions about returns on the enlarged capital base. The $3.9 billion full-year cash capital budget remains a substantial commitment, so weaker prices or execution could reduce cash available for debt repayment and shareholder returns.
- What are the biggest risks to Diamondback Energy stock?
- Oil and gas price volatility (High severity): Revenue and cash flow depend on commodity prices and realized sales terms. The Q2 2026 release reported an average oil price of $96.82 per barrel and a natural-gas price of negative $2.15 per Mcf. Capital intensity and execution (High severity): Management kept 2026 cash capital expenditure guidance at approximately $3.9 billion. Higher output must be delivered without cost overruns or weaker well performance to support the expected cash return. Debt and shareholder returns (High severity): Net debt was $12.304 billion at June 30, 2026. Future repurchases are discretionary and the company states its authorization may be suspended, modified or discontinued.
- What could move FANG stock next?
- 2026-11-03: Planned third-quarter 2026 results and conference call. Diamondback’s planned results can be assessed against the Q3 production and capital guidance in its August 3 release.
Company reference pages
Browse company filings and market quotes to check the latest information. These pages update over time and are separate from the documents cited in this report.