Amazon’s AWS Grew 37%. The Data-Center Bill Is the Valuation.
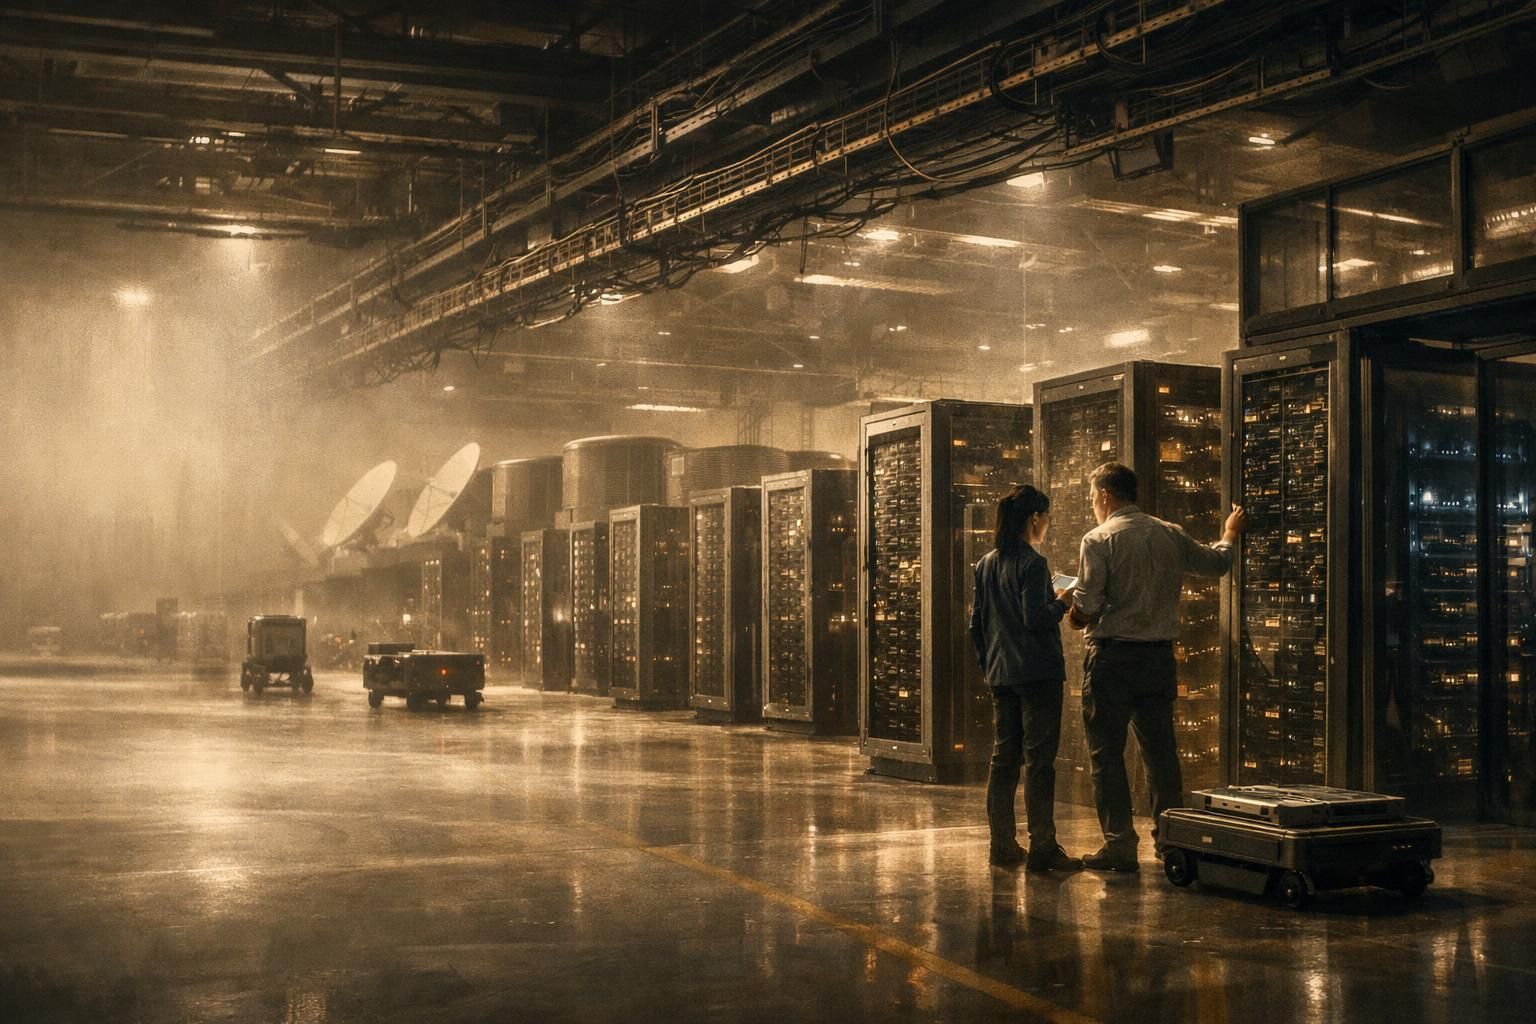
AWS growth and margins have accelerated, but Amazon’s AI build pushed trailing free cash flow below zero. At $251.89, the stock already prices in a substantial cash-flow recovery.
Price now
$251.89
At publication
$251.89
Fair value
$253.00
Upside
+0.4%
Fwd P/E
20.3x
EV/EBITDA
16.3x
FCF yield
-0.3%
ROIC 13.2% · Horizon Through 2030
Investment thesis
Why is this mispriced?
- 01
1. Amazon is increasingly a portfolio of infrastructure and service platforms rather than a conventional retailer. AWS, advertising and third-party seller services are growing faster than first-party commerce and should carry greater incremental value.
- 02
2. AWS growth accelerated to 36.8% in Q2 2026 and its operating margin reached 39.4%, while North America and International remained profitable. The operating evidence supports continued mix-driven margin expansion.
- 03
3. The market may understate the timing and magnitude of the data-center bill. TTM net property investment reached $169.0B, company-defined FCF fell to negative $7.6B, and an analytical all-in infrastructure measure implies a roughly $40.9B funding deficit.
- 04
4. At $251.89, Amazon is not materially mispriced relative to the $253 probability-weighted fair value. The price requires approximately $170B–$180B of sustainable 2030 FCF, continued AWS leadership and successful utilization of the AI build.
- 05
5. The thesis fails if AWS growth and margins deteriorate while capex remains elevated, if Trainium cannot satisfy performance-linked commitments, or if demand from financially linked AI customers proves less independent than headline contract values suggest.
Business
Overview
Amazon.com (Nasdaq: AMZN) is no longer best understood as an online retailer. It operates a global marketplace and logistics network, the largest cloud infrastructure platform by the supplied independent market-share estimate, a high-intent advertising platform, a subscription bundle and an increasingly integrated AI-compute stack. Q2 2026 revenue rose 20.0% to $200.6 billion, but the economic tension is capital intensity: trailing operating cash flow was $161.4 billion while Amazon-defined free cash flow was negative $7.6 billion after $169.0 billion of net property investment, primarily reflecting artificial-intelligence infrastructure spending, according to the Amazon Q2 2026 earnings release. Amazon made money through seven principal revenue sources in Q2. Online stores generated $70.4 billion, or 35.1% of sales, and grew 14.6%. Physical stores contributed $5.8 billion, or 2.9%, and grew 3.6%. Third-party seller services generated $46.8 billion, or 23.3%, and grew 15.9%. Advertising produced $19.8 billion, or 9.9%, and grew 26.2%. Subscription services contributed $13.7 billion, or 6.8%, and grew 12.5%. AWS generated $42.2 billion, or 21.1%, and grew 36.8%. Other revenue was $1.8 billion, or 0.9%, and grew 22.0%. The three reporting segments are North America, International and AWS. North America includes stores, marketplace fees, advertising and subscriptions in the region. International contains comparable commerce activities outside North America. AWS supplies compute, storage, databases, networking, AI services and related technology infrastructure. AWS represented only 21.1% of Q2 revenue but generated 60.5% of segment operating income. North America supplied 33.2% and International 6.3%. Revenue quality varies by activity. Store revenue is primarily transactional. Seller services and advertising are usage-linked and behaviorally recurring, but not equivalent to contracted subscription revenue. Prime and digital subscriptions are recurring. AWS combines consumption-based sales with long-duration commitments. Amazon reported approximately $496 billion of contractual performance obligations, primarily related to AWS, with a weighted-average remaining life of 6.4 years. Recognition still depends on usage and Amazon’s performance under the contracts, according to the Amazon Q2 2026 Form 10-Q. Amazon occupies several layers of its value chains. In commerce, brands and sellers reach consumers through the marketplace, Fulfillment by Amazon, advertising, payments and Amazon’s delivery network. In cloud and AI, semiconductor suppliers, power, networking and construction feed AWS data centers and Amazon-designed chips, which support cloud software used by enterprises, governments, developers and AI laboratories. Amazon designs chips but does not manufacture semiconductors; production relies on external supply chains. Incremental revenue depends on paid-unit growth, third-party seller penetration, fulfillment adoption, advertising demand, Prime engagement, AWS consumption, AI-compute demand and geographic expansion. Service revenue increased 23.7% in Q2, versus 13.7% product-revenue growth, and reached 61.3% of sales from 59.3% a year earlier. That shift toward higher-value services is central to the margin thesis.
For the financial history and all coverage, see AMAZON COM INC (AMZN) company research.
Institutional scorecard
Fairly valued/watchlist
Business quality
9
Multiple scaled platforms with strong reinvestment opportunities.
Technology/product
9
Broad cloud stack, custom chips, logistics automation and consumer platforms.
Competitive moat
9
Scale, data, network effects, logistics density and switching costs.
Industry opportunity
9
Cloud, AI, e-commerce and digital advertising remain structural growth markets.
Revenue growth
9
TTM growth accelerated to 15.0%; Q2 growth reached 20.0%.
Profitability
8
Record consolidated margins, but partly exposed to depreciation lag.
Free cash flow
4
Company-defined TTM FCF was negative $7.6B.
Balance sheet
8
Ample liquidity, but debt and contractual commitments have risen sharply.
Management
8
Strong recent operating execution and a credible long-term culture.
Capital allocation
6
Core reinvestment has created value; current AI spending and strategic investments require proof.
Insider alignment
7
Bezos retains 8.8%; operating executives own much less.
Governance
7
Single-class shares and an independent board majority, offset by a non-independent chair and related-party transactions.
Integrity
7
Clean audit record, but significant regulatory exposure and judgmental investment accounting.
Customer concentration
6
Consumer demand is diversified; AI contract commitments appear increasingly concentrated.
Geopolitical/regulatory risk
5
Material antitrust, privacy, labor, trade and international-ownership exposure.
Valuation
5
Fair rather than cheap after normalizing investment gains and FCF.
Long-term attractiveness
7
Exceptional asset base, but expected return depends on capex conversion.
Why are cloud, AI and e-commerce still structural growth markets?
Cloud and AI infrastructure provide Amazon’s most important structural opportunity. Worldwide cloud infrastructure spending reached approximately $143 billion in Q2 2026, up 43% year over year. AWS held an estimated 28% share, ahead of Microsoft at 20% and Google at 15%, according to the Synergy Research Group Q2 2026 cloud report. The quarterly figure implies a roughly $572 billion annualized category, although Amazon and Synergy use different market definitions.
AWS’s reported quarterly revenue of $42.2 billion is directionally consistent with the independent share estimate. The addressable opportunity extends beyond rented compute capacity to model training and inference, custom accelerators, databases, data lakes, cybersecurity, application modernization, software-development agents, hybrid computing, networking and observability. Industry growth does not ensure Amazon-specific growth, however. AWS grew 36.8% while the independent market grew 43%, suggesting that Amazon participated strongly but may have ceded some share to faster-growing competitors.
The scenario framework therefore does not assume automatic dominance. The bear case places AWS share at 22%–24% by 2030, the base case at approximately 27% and the bull case near 30%. These are valuation assumptions rather than company guidance. AWS must provide competitive capacity, chips and software while controlling the cost of power, construction and networking.
Commerce also retains structural growth. U.S. e-commerce sales were approximately $340.2 billion in Q2 2026, up 12.2% year over year and equal to 17.1% of retail sales, according to the U.S. Census Bureau Q2 2026 retail e-commerce report. Amazon’s North America segment grew 16.1%, although the comparison is imperfect because that segment includes Canada, Mexico, advertising, subscriptions and seller services in addition to U.S. commerce.
Amazon also participates in merchant logistics, retail media, subscription entertainment, grocery, healthcare, satellite communications and autonomous transportation. Their market sizes cannot be added mechanically because spending categories overlap. The economic question is whether Amazon’s integrated system captures more value than stand-alone competitors. AI adoption helps only if AWS has competitive capacity and software; e-commerce penetration helps only if Amazon preserves selection, price and delivery advantages; and retail-media growth helps only if merchants continue to earn acceptable returns from advertising on Amazon’s properties.
How defensible is Amazon’s technology and product stack?
AWS is a vertically integrated computing stack. Land, buildings, power, cooling and networking sit at the bottom. Amazon-designed chips and virtualization systems sit above that physical layer, followed by compute, storage, databases and AI services. Bedrock and application tools sit closer to the customer. This integration matters because AI economics depend on the cost and availability of the full system, not merely the accelerator.
Amazon reported that both its AI business and its broader chips business exceeded $25 billion annual revenue run rates. Trainium is designed for AI training and inference, while Graviton is an ARM-based general-purpose processor. Management said OpenAI and Anthropic made multi-year, multi-gigawatt Trainium commitments. The commercial agreements include obligations tied to AWS-chip performance, however, so these customers are not committing unconditionally to whatever hardware Amazon produces, as described in the Amazon Q2 2026 Form 10-Q.
Management says Graviton offers 30%–40% better price-performance than comparable instances and that Kiro is up to 50% more cost-effective than alternatives. These are company-reported marketing measures and were not independently benchmarked in the reviewed sources. The same qualification applies to several product performance claims in the earnings release.
Bedrock gives customers managed access to multiple foundation-model providers without requiring them to build the complete orchestration, security and governance layer. Model choice reduces dependence on one provider but does not remove the bargaining power of model developers. The moat instead rests on integration with AWS data and security services, infrastructure capacity, enterprise identity systems, developer tools, billing relationships and custom silicon.
Commerce technology is similarly integrated. Amazon combines demand forecasting, inventory placement, search, recommendations, reviews, warehouse automation, last-mile routing, advertising optimization, payments and fraud prevention. Any individual component can be reproduced. Recreating the full operating system, customer traffic, seller selection, logistics density and global asset base at equivalent scale is more difficult.
Switching costs are meaningful but incomplete. AWS customers face architecture redesign, retraining, data migration, governance changes and operating risk, while multicloud systems and open-source software can lower those barriers. Sellers accumulate FBA inventory, reviews, advertising history and marketplace demand. Consumers face lower formal switching costs, so Amazon must continually defend convenience and pricing. Patent count is not the central moat, and Amazon faces patent litigation involving S3, DynamoDB, Nitro and video technologies, according to the Amazon 2025 Form 10-K.
Amazon leads cloud, but Microsoft and Google are growing faster
Amazon remains the largest company in the supplied cloud-infrastructure share data, but its closest rivals have formidable economics. Amazon reported $200.6 billion of quarterly revenue, 20.0% growth and a 13.7% consolidated operating margin. AWS generated $42.2 billion, grew 36.8% and earned a 39.4% segment margin. Amazon’s adjusted enterprise value was approximately 29.4 times TTM operating income.
Microsoft reported $90.0 billion of quarterly revenue, 18.0% growth and a 45.1% operating margin. Microsoft Cloud revenue was $59.3 billion and grew 27%. Its estimated infrastructure share was 20%. Alphabet reported $119.8 billion of revenue, 24.2% growth and a 34.0% operating margin. Google Cloud generated $24.8 billion, grew 81.8% and earned a 35.6% margin. Google Cloud includes a broader product mix and should not be compared mechanically with AWS, but the direction is clear: Amazon remains the share leader while important rivals are growing faster. The peer figures come from the Microsoft FY2026 fourth-quarter release, Microsoft 2026 Form 10-K and Alphabet Q2 2026 Form 10-Q. Synchronized share prices were not supplied, so competitor valuation multiples were not manufactured.
Competition extends well beyond cloud. In commerce, Amazon faces Walmart, Costco, Target, Alibaba, JD.com, MercadoLibre, PDD and Temu, Shein and Shopify’s merchant ecosystem. In cloud and AI, alternatives include Microsoft Azure, Google Cloud, Oracle Cloud, CoreWeave and other neoclouds, private clouds, on-premise infrastructure and customer-owned data centers. Advertising and discovery competitors include Google, Meta, TikTok, social commerce, comparison-shopping services and AI assistants. Logistics competitors include UPS, FedEx, DHL, postal systems, third-party logistics providers and merchant-owned networks. Netflix, Disney, Apple, Google and Roku compete in media and devices.
Customers choose Amazon when the integrated system is more valuable than a collection of point products. Consumers receive selection and fast delivery; sellers obtain demand, fulfillment, payments and advertising; advertisers reach shoppers with high purchase intent; and AWS customers receive infrastructure breadth, geographic availability and a mature ecosystem. Disintermediation remains possible. Enterprises can use multiple clouds, AI labs can finance data centers or design chips, brands can build direct channels, sellers can shift inventory elsewhere, and AI assistants could redirect product discovery. Amazon’s moat lowers the probability of wholesale displacement but does not eliminate losses at the margin.
Do Amazon’s AI contracts represent independent demand?
Amazon’s consumer and seller bases are broadly diversified. The more important emerging concentration lies in long-duration AWS commitments from financially linked AI customers. OpenAI has an existing $38 billion AWS arrangement plus a $100 billion expansion over eight years. Amazon had invested $28.7 billion in OpenAI through Q2 and committed another $21.3 billion. The arrangement contains AWS-chip performance obligations, and recognized revenue was not disclosed.
Anthropic has an expanded AWS arrangement exceeding $100 billion over ten years. Amazon made a $10 billion preferred investment in Q2, and up to $15 billion may remain under a financing facility. Availability under that facility depends on Amazon meeting compute-delivery milestones. Recognized Anthropic revenue was not disclosed. Amazon also announced other AWS customers without providing contract lengths, minimum purchases or current revenue in most cases.
The OpenAI and Anthropic commitments total at least $238 billion, equivalent to approximately 48% of Amazon’s $496 billion performance-obligation balance if the announced commitments are fully represented in that figure. Amazon has not supplied an exact reconciliation, so 48% is an inference rather than a reported customer-concentration measure. Named supply-chain customers include Procter & Gamble, 3M, Lands’ End and American Eagle Outfitters, but production revenue and contract terms were not disclosed.
The strongest evidence of commercial validation is recognized revenue and cash collection. Non-cancellable minimum commitments and performance obligations rank next. Announced agreements with undisclosed economics are weaker, while trials and promotional partnerships provide the least evidence. Amazon’s $496 billion performance-obligation balance is meaningful, but it is not guaranteed backlog. Revenue timing depends on usage, service delivery, chip performance and contractual rights.
The financial links do not invalidate AI demand, but they complicate the economics. Amazon is investing in model developers that have committed to purchase Amazon cloud capacity. Gross AWS revenue from these relationships is not equivalent to a return on all the infrastructure and strategic capital deployed. Named-customer revenue, prepayments and cancellation rights are not disclosed. A central monitoring question is whether outside customers adopt Trainium without accompanying Amazon financing.
What do margins, cash flow and unit economics say about earnings quality?
Amazon’s operating recovery is substantial. Revenue increased from $469.82 billion in 2021 to $716.92 billion in 2025. Operating margin fell from 5.3% in 2021 to 2.4% in 2022, then recovered to 6.4% in 2023, 10.8% in 2024 and 11.2% in 2025. Operating income reached $79.98 billion in 2025. ROIC moved from 10.4% in 2021 to 4.5% in 2022, recovered to 15.8% in 2024, then declined to 13.2% in 2025 as invested capital expanded faster than after-tax operating income.
For the twelve months ended June 30, 2026, Amazon generated $775.68 billion of revenue, $93.71 billion of operating income and a 12.1% operating margin. Approximate EBITDA was $168.91 billion. Reported net income was $135.28 billion and diluted EPS was $12.44, but these are not sustainable earnings measures. TTM other income included $79.8 billion of non-operating income, primarily related to Anthropic. Q2 alone included $53.4 billion of pre-tax other income, according to the Amazon Q2 2026 Form 10-Q.
No consensus estimate was supplied. Relative to Q2 2025, revenue of $200.6 billion increased 20.0%, operating income of $27.5 billion rose 43.2%, and EPS of $5.75 exceeded $1.68 a year ago. The EPS comparison is distorted by investment gains. For Q3 2026, Amazon’s guide is revenue of $197.0 billion to $202.0 billion, with a $199.5 billion midpoint, and operating income of $22.5 billion to $26.5 billion, with a $24.5 billion midpoint.
Incremental margins were strong. Amazon generated $8.3 billion of additional consolidated operating income on $32.9 billion of additional Q2 revenue, a 25.2% incremental margin. AWS’s incremental operating margin was 56.9%, compared with 10.0% for North America and 4.1% for International. TTM revenue per employee was approximately $486,000 and operating income per employee was approximately $58,800.
Commerce unit economics remain favorable but warrant monitoring. Paid units increased 17.0%, the third-party seller mix was 61.0%, and shipping costs grew 19.0%. Shipping costs slightly outpaced units, suggesting that same-day delivery, capacity additions and mix consumed some efficiency gains, although the gap is insufficient to establish deterioration. Revenue per consumer, Prime economics, AWS revenue per customer and advertising retention are not disclosed. A dollar of AWS or advertising revenue remains economically more valuable than a dollar of first-party retail revenue.
Why did $161 billion of operating cash flow produce negative FCF?
The central forensic correction is that $161.4 billion was TTM operating cash flow, not free cash flow. Amazon’s company-defined FCF was negative $7.6 billion after $169.0 billion of net cash property investment. At the supplied market capitalization, the correct company-defined FCF yield is negative 0.3%, not positive 5.9%.
The cash-flow reconciliation begins with $135.28 billion of net income. Depreciation and amortization added $75.20 billion, stock-based compensation added $19.31 billion, and deferred taxes added $41.44 billion. Removing $79.82 billion of non-operating income and $30.02 billion of working-capital and other changes results in $161.40 billion of operating cash flow. Subtracting $169.01 billion of net cash property purchases produces the reported $7.60 billion outflow.
Several features matter for cash quality. Investment gains increase net income but not OCF. Deferred taxes supply a large positive reconciliation. Receivables and other operating assets consumed cash. SBC is added back even though it creates an owner cost through dilution. Amazon’s FCF definition also excludes infrastructure acquired through finance leases and property acquired but not yet paid for.
Amazon disclosed a $29.3 billion TTM increase in property acquired but not yet paid and $4.0 billion of property acquired through finance leases. Adding those amounts to net cash capex gives an illustrative all-in infrastructure investment of approximately $202.3 billion and an all-in funding deficit near $40.9 billion. This is an analytical measure rather than Amazon’s reported FCF, based on disclosures in the Amazon Q2 2026 Form 10-Q.
Normalized FCF cannot be observed precisely because Amazon does not separate maintenance and growth capex. The memo’s analytical range is $20 billion to $50 billion, assuming working-capital outflows normalize, annual economic capex moderates to $115 billion–$135 billion, SBC remains an owner cost and cash taxes move closer to normalized tax expense. That range implies a current normalized FCF yield of only 0.7%–1.8%. The valuation therefore depends on materially higher future cash production rather than present FCF.
Has Amazon’s AI build created a depreciation time bomb?
TTM net cash capex reached $169.0 billion, an increase of 64.1%. First-half property additions, including non-cash activity, were $118.6 billion. AWS accounted for $90.1 billion, or 76.0%, of those additions. AWS property and equipment rose from $190.1 billion at the end of 2025 to $263.8 billion only six months later.
Amazon does not disclose data-center megawatt capacity, utilization, construction cost per megawatt, chip yields, Trainium production volumes or revenue per accelerator. Those omissions make it impossible to calculate a direct return on the current AI build. The available financial statements show the scale of investment, but not whether the assets are operating at underwriting utilization.
The depreciation lag is the main earnings risk. Q2 AWS property additions were $48.6 billion, approximately six times quarterly AWS depreciation and amortization of $8.1 billion. Capacity is entering the asset base much faster than depreciation enters the income statement. Current AWS margins may therefore benefit from timing. If utilization disappoints, future margin pressure can emerge after the spending has become difficult to reverse.
An adverse sequence would begin with industry AI capacity expanding faster than monetizable demand. Cloud pricing would become more competitive, utilization would remain below assumptions, and depreciation, energy and staffing costs would rise. AWS operating margin could decline from 39.4% toward the high 20s while free cash flow remained weak despite continued accounting profit. A five-percentage-point reduction in AWS’s TTM margin would cut operating income by approximately $7.4 billion before secondary effects.
The thesis does not require capex to collapse immediately. It requires spending growth to slow enough for operating cash flow to overtake cash and non-cash infrastructure additions. If TTM net capex remains above $150 billion through 2028 while company-defined FCF stays negative, the base-case conversion thesis would be materially weakened.
Can the balance sheet absorb the infrastructure commitments?
Amazon ended June with $78.21 billion of cash and equivalents and $44.78 billion of marketable securities, for combined liquidity of $122.99 billion. Face-value debt was $133.00 billion. Cash-only net debt was $54.78 billion, while net debt including marketable securities was approximately $10.01 billion. Current assets of $249.26 billion modestly exceeded current liabilities of $241.27 billion, producing a 1.03 current ratio.
Other balance-sheet items include $38.18 billion of inventory, $88.09 billion of accounts receivable and other current assets, $20.43 billion of current unearned revenue, $109.77 billion of lease liabilities, $23.50 billion of goodwill and $551.62 billion of equity. Accounts receivable and other increased 30.1% in six months, from $67.7 billion to $88.1 billion, faster than revenue. TTM receivable growth used $21.4 billion of operating cash. No collection issue was disclosed, but the divergence warrants monitoring.
Contractual commitments extend beyond reported debt. Amazon disclosed approximately $130.1 billion of unconditional purchase obligations, $137.2 billion of leases not yet commenced, $116.4 billion of gross operating-lease obligations, $16.7 billion of gross finance-lease obligations and $220.3 billion of debt principal and interest commitments. These amounts should not simply be added together because some correspond to future operating capacity and may overlap with valuation assumptions. They nevertheless demonstrate a larger fixed-cost footprint than conventional net debt suggests.
Amazon had no borrowings under $20.0 billion of revolving facilities or $30.0 billion of commercial-paper programs at June 30. It also had access to an undrawn $17.5 billion delayed-draw term loan through September 30, 2026. Approximate gross debt to TTM EBITDA was 0.8 times, net debt including securities to EBITDA was 0.1 times, and debt plus lease liabilities to EBITDA was 1.4 times.
The company can withstand a severe downturn without issuing equity. The more relevant question is whether it would maintain current capex without continuing to raise debt. Book value was approximately $50 per fully diluted share. Equity less goodwill was approximately $528.1 billion, or $47.9 per share. Other intangible assets were not separately disclosed in the supplied balance sheet, so this is an upper-bound tangible-book estimate.
Are management, compensation and capital allocation aligned with per-share value?
Andy Jassy’s operating record has improved materially. Consolidated operating margin increased from 2.4% in 2022 to 11.2% in 2025 and 13.7% in Q2 2026. North America and International are profitable, and AWS growth has accelerated. Jeff Bezos remains founder and executive chair. Brian Olsavsky oversees finance during a sharp increase in debt and investment. Matthew Garman is responsible for AWS growth, custom chips and infrastructure utilization, while Douglas Herrington leads stores. David Zapolsky’s legal and policy role is important because of Amazon’s regulatory exposure.
The unresolved management test is capital allocation. Amazon is deploying capital into AI infrastructure, Anthropic, OpenAI, Leo and Zoox at a scale that can overwhelm otherwise strong operations. The Amazon 2026 proxy statement did not list a separate COO or CTO among named executive officers. The board includes relevant technology and AI expertise, including Andrew Ng and Daniel Huttenlocher.
Bezos beneficially owned 950.4 million shares, or 8.8%, as of February 24, 2026. Vanguard held 7.2% and BlackRock 5.9%. Jassy owned 2.3 million shares, approximately 0.02%, while Olsavsky, Garman and Herrington owned much smaller percentages. Bezos provides meaningful founder alignment without voting control. Other executives are aligned principally through compensation and unvested RSUs rather than large personally purchased stakes.
Amazon has no annual cash incentive program. Equity awards are periodic rather than annual, typically vest over five years or longer, and are back-end weighted. The program has no above-target vesting and relies mainly on time-based rather than ROIC- or FCF-based awards. Reported 2025 compensation was $2.07 million for Jassy, $1.68 million for Bezos, $0.37 million for Olsavsky, $0.62 million for Garman, $0.43 million for Herrington and $0.37 million for Zapolsky. No new stock awards were granted to named executives in 2025, although Jassy held approximately 1.05 million unvested RSUs worth $242.3 million at year-end and realized $43.2 million from vesting during 2025.
Company-wide TTM SBC was $19.3 billion, equal to 2.5% of revenue, 12.0% of OCF and 20.6% of operating income. Capital allocation currently prioritizes infrastructure, fulfillment, strategic AI investments, content, devices, Leo and Zoox. Amazon pays no dividend and made no repurchases in the first half. Core reinvestment has historically created value, but current spending has shifted the burden of proof back to management.
How much dilution and strategic-asset risk is hidden in the valuation?
Amazon’s FY2023 diluted weighted-average share count was 10.492 billion. It increased to 10.721 billion in FY2024, 10.827 billion in FY2025 and 10.903 billion in Q2 2026. At June 30, actual common shares were 10.783 billion and fully diluted shares, including awards, were 11.027 billion. The 244 million outstanding stock awards equaled 2.3% of common shares. Fully diluted shares increased 5.1% from FY2023’s diluted average to June 2026.
The remaining repurchase authorization was $6.1 billion, and Amazon made no repurchases during the first half of 2026. At $251.89, that authorization could retire only about 24 million shares, or roughly 0.2% of fully diluted shares. The valuation uses 11.027 billion shares and assumes future dilution is approximately offset by repurchases. If the share count instead rises 1.0% annually through 2030, per-share fair value would be roughly 4% lower.
Strategic investments add another layer of valuation uncertainty. At June 30, Anthropic preferred stock was recorded at $92.5 billion and Anthropic convertible notes at $97.9 billion. Amazon had invested $28.7 billion in OpenAI preferred stock, with another $21.3 billion committed. Up to $15.0 billion potentially remained under the Anthropic financing arrangement.
These assets may generate financial returns and reinforce AWS demand, but their valuations are highly judgmental. Anthropic securities are Level 3 assets whose values depend on security rights, liquidity events, marketability discounts and financing rounds. Q2 upward adjustments added approximately $50.5 billion to pre-tax income. This accounting is not evidence of misconduct, but it makes headline EPS an unreliable operating indicator and creates the potential for future reversals.
The base valuation assigns $120 billion of net strategic-asset value after debt, tax, illiquidity and remaining commitments. The bear case assigns only $40 billion and the bull case $187 billion. This explicit haircut is necessary because recorded asset values cannot be treated as equivalent to unrestricted cash.
What do governance, regulatory exposure and cyclicality imply for risk?
Amazon has one class of shares, one vote per share, annual director elections, majority voting, a declassified board and a lead independent director. Nine of the eleven 2026 board nominees appear independent, and shareholders can call special meetings under disclosed procedures. The main governance weakness is that Bezos remains executive chair rather than an independent chair.
Related-party activity with Bezos-owned Blue Origin is material. Amazon previously expected to pay approximately $2.7 billion under satellite-launch agreements, and estimated payments since the start of the prior fiscal year were approximately $1.8 billion. The audit committee reviews related-party transactions, but Amazon states that it has no written related-person transaction policy and relies on the committee’s business judgment.
EY has served as auditor since 1996 and issued unqualified opinions on Amazon’s 2025 financial statements and internal control. No material weakness, auditor disagreement or restatement was disclosed. Amazon also identified the Anthropic gains and FCF deterioration prominently, according to the Amazon 2025 Form 10-K.
Regulatory exposure is broad. Amazon agreed on June 30, 2026 to pay $2.25 million to settle FTC allegations involving Fair Credit Reporting Act requirements for identity-theft victims, as documented by the FTC Amazon FCRA case. On August 31, 2026, the FTC and states filed another case alleging a secret advertising surcharge scheme. The filing is verified, but the allegations remain unproven; the proceeding appears on the FTC Amazon cases page. Amazon’s filings also describe disputed antitrust and consumer cases in the United States, Canada and United Kingdom.
Other exposures include privacy and biometric laws, AI and cloud-security rules, tariffs, semiconductor constraints, export controls, Indian foreign-ownership restrictions, Chinese licensing and data localization, tax policy, and data-center energy and water regulation. Amazon also benefits from accelerated depreciation and immediate U.S. R&D expensing. The $41.4 billion TTM deferred-tax reconciliation demonstrates the importance of tax timing to cash flow.
Amazon is exposed to consumer spending, advertising, enterprise IT, semiconductor supply, data-center construction, power prices, rates, foreign exchange and content cycles. Reported net income is near a peak because Anthropic gains cannot be annualized. Operating earnings may not be at a structural peak, but AWS’s 39.4% margin and the consolidated 13.7% margin may be near local highs because depreciation has not caught up with capex. A one-percentage-point consolidated margin decline on $775.7 billion of revenue would reduce operating income by about $7.8 billion and after-tax operating earnings by approximately $6.1 billion under a 21% tax assumption.
What does today’s price require Amazon to deliver?
At $251.89, Amazon’s market capitalization is $2.746 trillion. Cash-only enterprise value is $2.801 trillion, while enterprise value including marketable securities is approximately $2.756 trillion. The stock trades at 3.6 times TTM revenue, 29.4 times TTM operating income and approximately 16.3 times EBITDA. Reported TTM P/E is 20.3 times, but that multiple is misleading because EPS contains Anthropic valuation gains.
Applying a 21% tax assumption to TTM operating income produces approximately $74.0 billion of normalized after-tax operating earnings, or about $6.70 per fully diluted share. The corresponding operating-earnings multiple is roughly 37 times. OCF yield is 5.9%, but company-defined FCF yield is negative 0.3%. PEG cannot be calculated without synchronized consensus growth estimates, and price to FCF is not meaningful while reported FCF is negative.
The base valuation assumes $1.15 trillion of 2030 revenue, $175 billion of normalized FCF, a 15.2% FCF margin, a 22 times terminal multiple, a 9.0% discount rate and 4.25 years to the terminal date. Discounting $175 billion multiplied by 22 produces approximately $2.670 trillion of operating value. Adding $120 billion of net strategic-asset value gives equity value of approximately $2.790 trillion. Dividing by 11.027 billion fully diluted shares produces fair value of approximately $253.
The reverse DCF shows what must occur. At a $2.746 trillion market capitalization, sustainable FCF of $137 billion would support a 20 times mature multiple, $110 billion would support 25 times and $92 billion would support 30 times. When a 9% required return and a 22–23 times 2030 multiple are incorporated, the current price requires approximately $170 billion–$180 billion of sustainable 2030 FCF after giving some credit to strategic investments.
Generating $175 billion of FCF would require $1.46 trillion of revenue at a 12.0% margin, $1.17 trillion at 15.0%, or $972 billion at 18.0%. The base case uses approximately $1.15 trillion and 15.2%. Operationally, that means consolidated revenue growth near 10% annually through 2030, AWS growth above the corporate rate, AWS margins above 30%, advertising outgrowing retail, improved data-center utilization, capex falling materially relative to OCF, no destructive antitrust remedy and limited dilution. The stock is not priced for perfection, but it is priced for successful capex conversion.
What would prove the Amazon thesis wrong?
The clearest operational warning would be AWS growth below 20% for two consecutive quarters while the cloud market continued to grow materially faster. That combination would imply company-specific share loss rather than a normal industry slowdown. An AWS operating margin below 30% without a clearly temporary cause would separately challenge the assumption that utilization and custom silicon can offset depreciation and pricing pressure.
Cash conversion is the second test. The base thesis would be materially weakened if TTM net capex remained above $150 billion through 2028 while company-defined FCF stayed negative. Consolidated operating margin falling below 10% or advertising growth remaining below 15% for multiple quarters would show that higher-margin businesses were no longer offsetting retail and infrastructure costs.
The AI-contract thesis would be impaired if Trainium failed to satisfy performance-linked customer obligations or if OpenAI or Anthropic materially renegotiated or cancelled commitments. Evidence that customer spending was primarily supported by Amazon financing rather than independent demand would call into question both revenue quality and the return on strategic investments.
Per-share economics would deteriorate if fully diluted shares grew more than 2% annually. Financial risk would rise if net debt, including marketable securities, exceeded $100 billion without equivalent liquid strategic-asset value. Structural antitrust remedies separating marketplace, fulfillment or advertising economics would threaten the integrated model that supports seller adoption and retail-media monetization.
Finally, a material internal-control weakness, restatement or accounting investigation would invalidate the current integrity assessment. These are not routine quarterly disappointments; they are observable conditions that would require a lower margin outlook, a higher discount rate, a smaller strategic-asset value or some combination of all three.
Financial performance
The numbers
Revenue ($B)
Margins (%)
Free cash flow ($B)
ROIC vs net debt
Source: SEC EDGAR XBRL filings, latest restated values; quarterly cash flow derived from year-to-date figures; Q4 = fiscal year minus nine months. ROIC is NOPAT (21% tax) over debt plus equity.
| Period | Revenue | Gross % | Op % | FCF | EPS | ROIC % | Net debt |
|---|---|---|---|---|---|---|---|
| Q3 FY2023 | 143.1 | 0.00 | 7.80 | 21.2 | 0.94 | 14.1 | 17.9 |
| Q4 FY2023 | 170.0 | 0.00 | 7.80 | 42.5 | 1.01 | 15.5 | -6.21 |
| Q1 FY2024 | 143.3 | 0.00 | 10.7 | 19.0 | 0.98 | 17.1 | -6.00 |
| Q2 FY2024 | 148.0 | 0.00 | 9.90 | 25.3 | 1.26 | 15.5 | -8.49 |
| Q3 FY2024 | 158.9 | 0.00 | 11.0 | 26.0 | 1.43 | 17.2 | -14.6 |
| Q4 FY2024 | 187.8 | 0.00 | 11.3 | 45.6 | 1.86 | 19.5 | -20.8 |
| Q1 FY2025 | 155.7 | 0.00 | 11.8 | 17.0 | 1.59 | 16.0 | -7.46 |
| Q2 FY2025 | 167.7 | 0.00 | 11.4 | 32.5 | 1.68 | 15.5 | -1.66 |
| Q3 FY2025 | 180.2 | 0.00 | 9.70 | 35.5 | 1.95 | 13.0 | -11.8 |
| Q4 FY2025 | 213.4 | 0.00 | 11.7 | 54.5 | 1.95 | 16.4 | -18.0 |
| Q1 FY2026 | 181.5 | 0.00 | 13.1 | 26.0 | 2.78 | 13.4 | 20.8 |
| Q2 FY2026 | 200.6 | 0.00 | 13.7 | 45.4 | 5.75 | 12.7 | 54.8 |
From the calls
Management commentary
Demand
“AWS is booming, growing 36.7% year-over-year in Q2—our fastest growth in 18 quarters—and our AI and Chips businesses each eclipsed run rates of more than $25 billion.”
“In Stores, we again set record delivery speeds for Prime members in the first half of the year—over 40% more items delivered same-day or overnight—with Grocery and Everyday Essentials growing meaningfully faster than the rest of the business.”
“Advertising had another strong quarter with 26% year-over-year growth.”
Guidance
“Net sales are expected to be between $197.0 billion and $202.0 billion, or to grow between 9% and 12% compared with third quarter 2025.”
“Operating income is expected to be between $22.5 billion and $26.5 billion, compared with $17.4 billion in third quarter 2025.”
Capex
“Free cash flow decreased to an outflow of $7.6 billion for the trailing twelve months, driven primarily by a year-over-year increase of $66.1 billion in purchases of property and equipment, net of proceeds from sales and incentives. This increase primarily reflects investments in artificial intelligence.”
Valuation
Three scenarios
Dot marks the current price of $251.89.
Bear
25%$150
Discounted 2030 normalized FCF plus a heavily discounted strategic-asset value
- 2030 revenue
- $950B
- 2025–2030 revenue CAGR
- 5.8%
- Operating margin
- 11.0%
- Normalized FCF
- $110B
- FCF margin
- 11.6%
- Terminal FCF multiple
- 22x
- Discount rate
- 10.0%
- Net strategic-asset value
- $40B
- Present-value equity
- $1.65T
AI supply catches demand, AWS share falls toward the low 20s, AWS margin declines toward 28%, advertising slows and capex stays elevated. Strategic AI holdings receive a severe haircut.
Base
50%$253
Discounted 2030 normalized FCF plus net strategic-asset value
- 2030 revenue
- $1.15T
- 2025–2030 revenue CAGR
- 9.9%
- Operating margin
- 14.5%
- Normalized FCF
- $175B
- FCF margin
- 15.2%
- Terminal FCF multiple
- 22x
- Discount rate
- 9.0%
- Net strategic-asset value
- $120B
- Present-value equity
- $2.79T
- Fully diluted shares
- 11.027B
AWS remains a leading cloud platform with share in the high 20s. Advertising and seller services outgrow retail, consolidated margin reaches the mid-teens, and FCF improves as capex growth slows.
Bull
25%$356
Discounted 2030 normalized FCF plus a higher retained value for strategic AI investments
- 2030 revenue
- $1.35T
- 2025–2030 revenue CAGR
- 13.5%
- Operating margin
- 17.5%
- Normalized FCF
- $230B
- FCF margin
- 17.0%
- Terminal FCF multiple
- 23x
- Discount rate
- 8.5%
- Net strategic-asset value
- $187B
- Present-value equity
- $3.93T
Amazon captures a large share of AI infrastructure growth, custom silicon lowers its cost base, AWS sustains high-30s margins, logistics becomes a profitable third-party platform and strategic AI investments retain substantial value.
Both sides
Bull vs bear
Bull case
- AWS grew 36.8% in Q2 2026, its fastest rate in 18 quarters, while its operating margin reached 39.4%.
- Advertising grew 26.2%, seller services 15.9% and online stores 14.6%, reinforcing the shift toward higher-value service revenue.
- Consolidated operating margin reached 13.7%, and both North America and International remained profitable.
- Amazon has multiple reinforcing moats across cloud switching costs, marketplace demand, logistics density, high-intent advertising and Prime engagement.
- Custom silicon, Bedrock and long-duration contracts could convert the AI infrastructure build into durable cloud growth and lower unit costs.
Bear case
- Company-defined TTM FCF was negative $7.6B after $169.0B of net property investment, and an all-in analytical measure suggests a roughly $40.9B funding deficit.
- AWS property additions are running far ahead of depreciation, creating delayed margin risk if utilization disappoints.
- Reported TTM EPS includes large Anthropic valuation gains and materially overstates sustainable operating earnings.
- OpenAI and Anthropic commitments are linked to substantial Amazon investments, complicating the independence and return profile of the demand.
- At $251.89, the stock already requires approximately $170B–$180B of sustainable 2030 FCF and successful capex conversion.
What could break
Risk matrix
| Risk | Severity | Probability | Rationale |
|---|---|---|---|
| AWS growth falls below 20% for two consecutive quarters | High | Medium | If cloud-industry growth remains materially higher, sustained sub-20% AWS growth would indicate company-specific share loss. |
| AWS operating margin falls below 30% | High | Medium | A sustained decline without a temporary explanation would indicate weak utilization, pricing pressure or a larger-than-expected depreciation burden. |
| Capex remains above $150B through 2028 while FCF stays negative | High | Medium | This would directly contradict the thesis that the infrastructure build will convert into shareholder cash flow. |
| Trainium misses performance-linked obligations | High | Medium | Customer commitments contain chip-performance conditions, making technical execution central to contract conversion. |
| OpenAI or Anthropic commitments are renegotiated or cancelled | High | Low | The disclosed commitments represent a potentially large portion of AWS performance obligations and planned capacity demand. |
| Consolidated operating margin falls below 10% | High | Low | A sub-10% margin would reverse much of the post-2022 operating recovery and reduce normalized earnings power. |
| Advertising growth remains below 15% | Medium | Medium | Advertising is one of Amazon’s highest-margin commerce monetization engines and is central to the mix thesis. |
| Fully diluted shares grow more than 2% annually | Medium | Medium | Persistent dilution would reduce per-share participation in operating growth and lower fair value. |
| Net debt exceeds $100B after marketable securities | High | Low | Debt growth without equivalent liquid strategic assets would reduce financial flexibility during an infrastructure downturn. |
| Structural antitrust remedies separate marketplace economics | High | Low | Separation of marketplace, fulfillment or advertising could weaken the integrated commerce model. |
| AI demand is primarily supported by Amazon financing | High | Medium | This would weaken revenue quality and imply lower independent demand for the infrastructure being constructed. |
| Material control weakness, restatement or accounting investigation | High | Low | Any such event would invalidate the current integrity assessment and raise the cost of capital. |
Timeline
Catalysts
- Q3 2026 resultsNeutral
Performance against management’s Q3 guide
Revenue guide is $197.0B–$202.0B, with a $199.5B midpoint; operating-income guide is $22.5B–$26.5B, with a $24.5B midpoint.
- September 30, 2026Neutral
Delayed-draw term-loan deadline
Amazon’s undrawn $17.5B delayed-draw term-loan commitment expires or must be used by this date.
- Next three monthsBullish
AWS growth, margins and Trainium conversion
Updates may show whether AI commitments are becoming recognized revenue without weakening AWS margin.
- FY2026 results and 2027 outlookNeutral
Capex and utilization disclosure
The capex outlook, depreciation progression and company-defined FCF will test whether infrastructure spending is approaching cash conversion.
- Six to twelve monthsBullish
OpenAI and Anthropic revenue recognition
Greater disclosure on recognized revenue, concentration and contract conversion would improve assessment of demand quality.
- Six to twelve monthsBullish
Leo and Zoox commercialization
Initial satellite-service economics and paid Zoox rides could provide evidence for options that currently receive little valuation credit.
- One to three yearsBullish
FCF recovery toward $100B or more
A sustained transition from construction to utilization would validate the central AI-capex thesis.
- One to three yearsBearish
Material antitrust remedy or settlement
A remedy affecting marketplace, fulfillment or advertising integration could weaken consolidated economics.
History
Thesis tracker
| Period | Fair value | Verdict | Note |
|---|---|---|---|
| Q2 FY2026 | $253 | Fairly Valued | Initiated coverage after AWS growth accelerated to 36.8% and consolidated operating margin reached 13.7%. Fair value is constrained by a $7.6B company-defined trailing free-cash-flow outflow and sharply higher AI infrastructure spending. |
| September 10, 2026 | $253 | Fairly Valued | Deep-dive valuation confirms that the $251.89 price is close to probability-weighted fair value. The thesis still requires roughly $175B of sustainable 2030 FCF and successful conversion of the AI infrastructure build. |
Developments
Related news
Every quarter
What to monitor
AWS revenue growth relative to cloud-market growth
Distinguishes structural industry growth from Amazon-specific share gains or losses.
AWS operating margin
Best available indicator of utilization, pricing and depreciation pressure.
TTM net capex
Determines when operating earnings can convert into shareholder cash flow.
Property acquired but not yet paid
Reveals infrastructure obligations omitted from current cash capex.
Company-defined FCF and FCF after SBC
Measures actual cash economics after infrastructure investment and owner dilution.
Advertising growth
Tracks one of Amazon’s highest-margin commerce monetization engines.
North America and International margins
Shows whether logistics density and retail scale are creating value.
Paid-unit growth versus shipping-cost growth
Measures delivery-network unit economics.
AWS performance obligations and AI-customer concentration
Tests the quality and independence of contracted cloud demand.
Fully diluted shares and SBC
Measures whether growth is reaching each share.
Cash plus securities minus debt
Tracks financial flexibility during the infrastructure build.
Cash taxes versus tax expense
Identifies temporary cash-flow support from tax timing.
Across the value chain
Alternatives, ranked
- 01
MSFT · Microsoft · Cloud, enterprise software and AI alternative
Highest business-quality ranking in the memo; principal risk is AI capital intensity and platform concentration.
- 02
GOOGL · Alphabet · Cloud, AI models, search and advertising alternative
Combines fast cloud growth with highly profitable advertising; principal risk is AI disruption to search economics.
- 03
META · Meta Platforms · Advertising and consumer-AI alternative
Offers more direct exposure to digital advertising and consumer AI, with regulation and platform volatility as key risks.
- 04
TSM · Taiwan Semiconductor Manufacturing · AI semiconductor manufacturing alternative
Critical manufacturing moat and direct AI exposure, offset by Taiwan geopolitical risk.
- 05
NVDA · Nvidia · AI accelerators and networking alternative
More direct compute exposure than Amazon, with expectations and customer insourcing as principal risks.
- 06
MELI · MercadoLibre · Commerce and fintech growth alternative
Strong regional growth and network effects, with macroeconomic and currency exposure.
- 07
WMT · Walmart · Omnichannel commerce and advertising alternative
A scaled commerce platform with lower structural margins than Amazon.
- 08
SHOP · Shopify · Merchant software and payments alternative
Provides merchant-enablement exposure without Amazon’s logistics footprint; competition and merchant cyclicality remain risks.
- 09
ORCL · Oracle · Cloud infrastructure and database alternative
Offers cloud and database exposure, with leverage and execution as principal risks.
Continue your research
More on AMAZON COM INC
Related reports
- Amazon's AWS Grew 37%. AI Capex Ate the Cash Flow.
Earnings Update · 10 Sept 2026
Quarterly earnings
- AMAZON COM INC Q2 FY2026 earnings analysis
10 Sept 2026
Independent checks
Company reference pages
Browse company filings and market quotes to check the latest information. These pages update over time and are separate from the documents cited in this report.
Citations
Sources
- 01Amazon Q2 2026 Form 10-Q
- 02Amazon Q2 2026 Earnings Release
- 03Amazon 2025 Form 10-K
- 04Amazon 2026 Proxy Statement
- 05Synergy Research Group — Q2 2026 Cloud Infrastructure Market
- 06Synergy Research Group — Q2 2026 Cloud Infrastructure Market, supplied tracking URL
- 07U.S. Census Bureau — Q2 2026 Retail E-Commerce Sales
- 08U.S. Census Bureau — Q2 2026 Retail E-Commerce Sales, supplied tracking URL
- 09Microsoft FY2026 Fourth-Quarter Earnings Release
- 10Microsoft FY2026 Fourth-Quarter Earnings Release, supplied tracking URL
- 11Microsoft 2026 Form 10-K
- 12Alphabet Q2 2026 Form 10-Q
- 13FTC — Amazon Fair Credit Reporting Act Case
- 14FTC — Amazon Fair Credit Reporting Act Case, supplied tracking URL
- 15FTC — Amazon Cases and Proceedings
- 16FTC — Amazon Cases and Proceedings, supplied tracking URL